10 Nov Class size vs. achievement
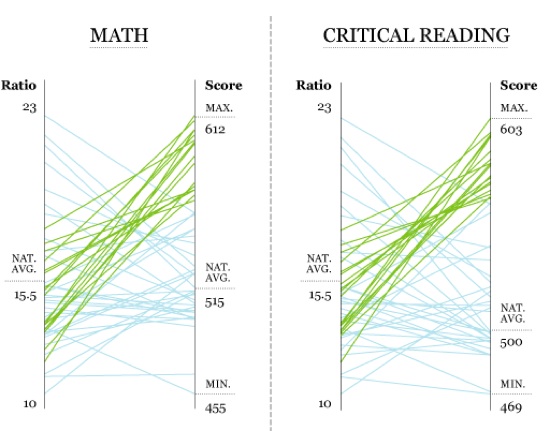
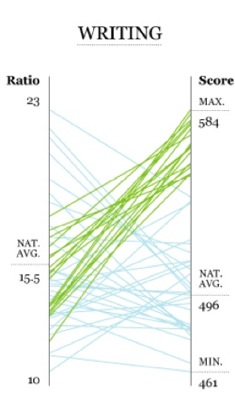
How much does class size affect performance on standardized tests? The charts displayed below plot US state-level student-teacher ratios against against the results for three parts of the SAT Reasoning Test (formerly Scholastic Aptitude Test and Scholastic Assessment Test) used in US college admissions.


..
..
..
These tables, from the wonderful FlowingData website, obviously use US data, but the results may have implications here.
States with higher SAT scores are shown in green, and generally have lower student-teacher ratios.
The ratio is not perfect, however. Utah has the largest classes in the US, but maintains better-than-average test scores. Maine has the smallest classes in the country, but ranks among the lowest in SAT scores.
Click for a larger version and a fuller explanation.
Whether SATs measure anything that could remotely be termed “aptitude” is another question.
