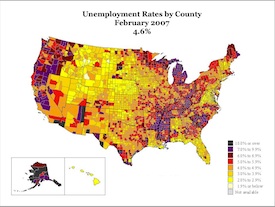
02 Aug Visual data: The American unemployment explosion
Posted at 23:52h
in U.S. Politics
A simple interactive graphic brings home the recession’s impact on US jobs.


Youtube version here. Who wants to make a Canadian version? Oh, right, you have to have a government that makes data readily available in machine readable formats. And if it’s survey data, you need a random sample.
Hat tip: Andrew Sullivan