04 Nov Sydney overkill and Beijing underkill
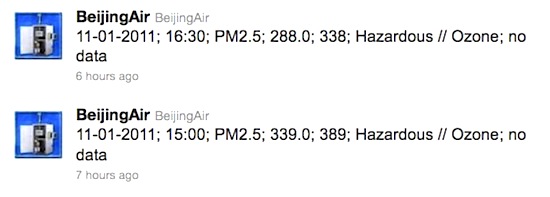
Earlier this week, various blogs and media outlets reported that Beijing was experiencing frightful levels of air pollution. To document the crisis, China hand James Fallows cited what he called “the indispensable (and highly controversial)” Twitter feed @Beijingair, which produces hourly readings of fine particulate matter (PM2.5) in Beijing. On Monday, @Beijingair showed readings in excess of 300 µg/m3, contributing to conditions the US EPA characterizes as “hazardous,” and warranting “health warnings of emergency conditions.”

What caught my attention was Fallows’s assertion that the @BeijingAir feed is “the only known source of PM 2.5 readings in China.” That is astounding: one PM2.5 meter for a nation of 1.3 billion people. By contrast, Sydney, Nova Scotia, population ~27,000,* has seven instruments that monitor PM2.5.
Bear with me for a brief technical digression. PM2.5 is a measure of the concentration of airborne particles smaller than 2.5 microns (millionths of a metre)—tiny particles that can find their way deep inside people’s lungs. It’s the air quality scientist’s indicator of choice for air pollution most likely to damage health.
To confound matters further, Sydney’s closely monitored air quality appears to be quite good. Here is the most recent publicly available data, from a 24-hour sample collected on October 12.

Each column represents a different monitoring station, each of which has two types of monitors. The highest reading among them was less than 1/1ooth of that registered this week in Beijing. These monitors run for 24 hours once every six days, a schedule that coincides with Canada’s National Air Pollution Surveillance (NAPS) network. A seventh Sydney-based unit operates continuously and contributes data used to calculate Environment Canada’s Air Quality Health Index (AQHI), but the PM2.5 results are not reported separately.
This appears to be a clear case of underkill in Beijing, where much better data is warranted, and I would argue, overkill in Sydney, where air quality has been unremarkable by North American standards for the last two decades. Over-measurement in Sydney reflects the public panic over the Tar Ponds cleanup in the late ’90s and early ‘oughts. A few environmental activists persuaded residents that air-quality impacts from the Tar Ponds were putting their health at risk, a falsehood Environment Canada has been loathe to correct. Ironically, back before Sydney’s coke ovens closed in 1988, the city’s air likely did pose a health hazard, but went largely unmonitored.
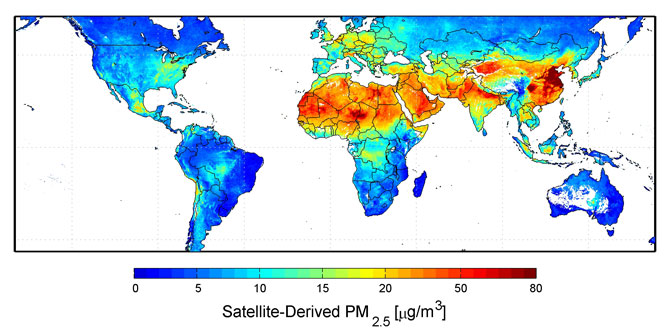
The relative hazards of air quality in China vs. Nova Scotia show up clearly in this NASA map compiled from satellite readings of average PM2.5 levels around the world between 2001 and 2006:

I would ascribe both conditions — Sydney overkill and Beijing underkill — to the politicization of environmental monitoring. Back when Sydney’s polluting steel mill and coke ovens were the largest employer in a region short of jobs, few people wanted to hear about associated environmental concerns, and government was content to turn a blind eye. Similarly, the Chinese government is reluctant to highlight the environmental costs of its spectacular economic growth (although, as Fallows often points out, its environmental record is not so indifferent as some in the west assume).
In subsequent posts on Beijing air monitoring, Fallows has subtly adjusted his claim about @Beijingair’s putative uniqueness in China. He now describes it as “the only public readings of PM 2.5.” The controversial feed is based on an air monitoring unit on the roof of the US Embassy in Beijing. Official chinese annoyance over it was the subject of a Wikileaks cable, and may have contributed to the Chinese government decision to block access to Twitter in 2009. There are welcome early signs, here and here, that China may soon begin more appropriate monitoring. I would be surprised if they are not secretly monitoring PM2.5.
My point here is that citizens should take care to view environmental hazards in context, and always remain mindful that any chemical hazard is proportional to dose.
—
*Sydney no longer exists as a municipal unit, having been amalgamated into the Cape Breton Regional Municipality in 1995. Wikipedia puts the “Sydney area” population in the 2006 census at 33,012, but this is suspiciously high. I was unable to ferret out local population numbers from StatsCan’s online census information, but will be delighted if readers can steer me to them.
