10 Jul Charting the rise in natural catastrophes
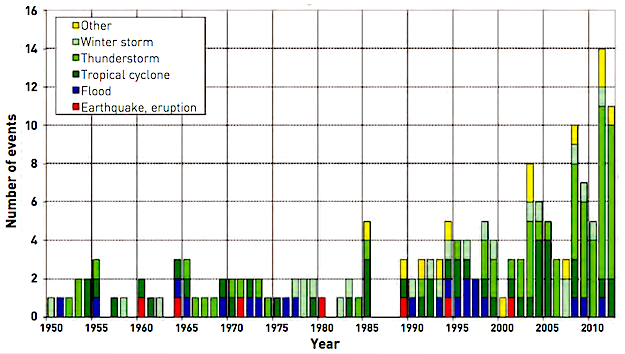
The number of “significant” natural catastrophes in North America causing more than $1 billion in losses of more than 50 deaths, 1950-2012:
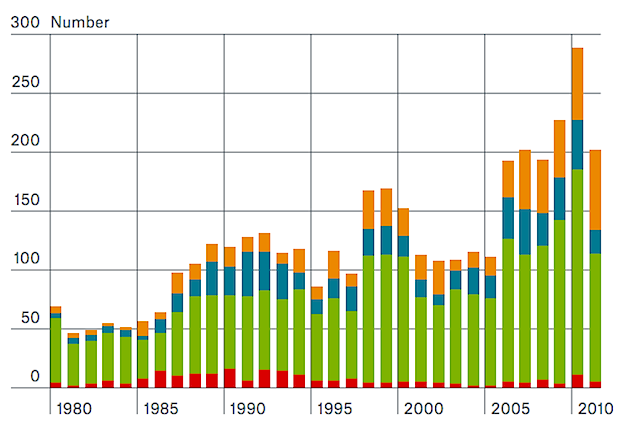
Number of natural catastrophes in North America, 1980-2011:

For the climate change skeptics in the audience, these charts come not the Ecology Action Centre, the Natural Resources Defence Council, or the Pembina Institute, but from Munich Re, a $265-billion company that is one of the world’s leading reinsurance brokers. (A reinsurer is an outfit that re-sells insurance liabilities when the risk becomes too great for a single retail firm, so it is on the front lines when catastrophic events loom.)
Bear in mind, this is what has already happened, when the sea level rise and ocean warming forecast by climate scientists has barely begun.
Both charts originated in Severe weather in North America: Perils · Risks · Insurance, a 260-page report Munich Re produced on the rise in major natural events. Perhaps because our coastlines are so built up, the rise is occurring faster in North American than in other parts of the world. The top chart is reproduced in a 44-page report of a forum hosted by the Washington DC-baseed Urban Land Institute: Risk & Resilience in Coastal Regions: A ULI Global Policy and Practice Forum Report [PDF]. The bottom chart appears in a 12-page executive summary [PDF] Munich Re’s report, the full version of which is available from the company for $100.
Take a walk along the shoreline of any city in Atlantic Canada. The Gabarus Sea Wall ain’t the only thing we need to be worried about.
H/T: Richard Stephenson